
Compare
Side-by-side nutrition for the items you've picked. Not a claim about which is "healthier" overall — just the numbers, so you can weigh the tradeoffs yourself.
Highest protein
Pistachio & Raspberry Delice
Lowest calories
Cinnamon Scroll
Best protein per calorie
Pistachio & Raspberry Delice
Starbucks
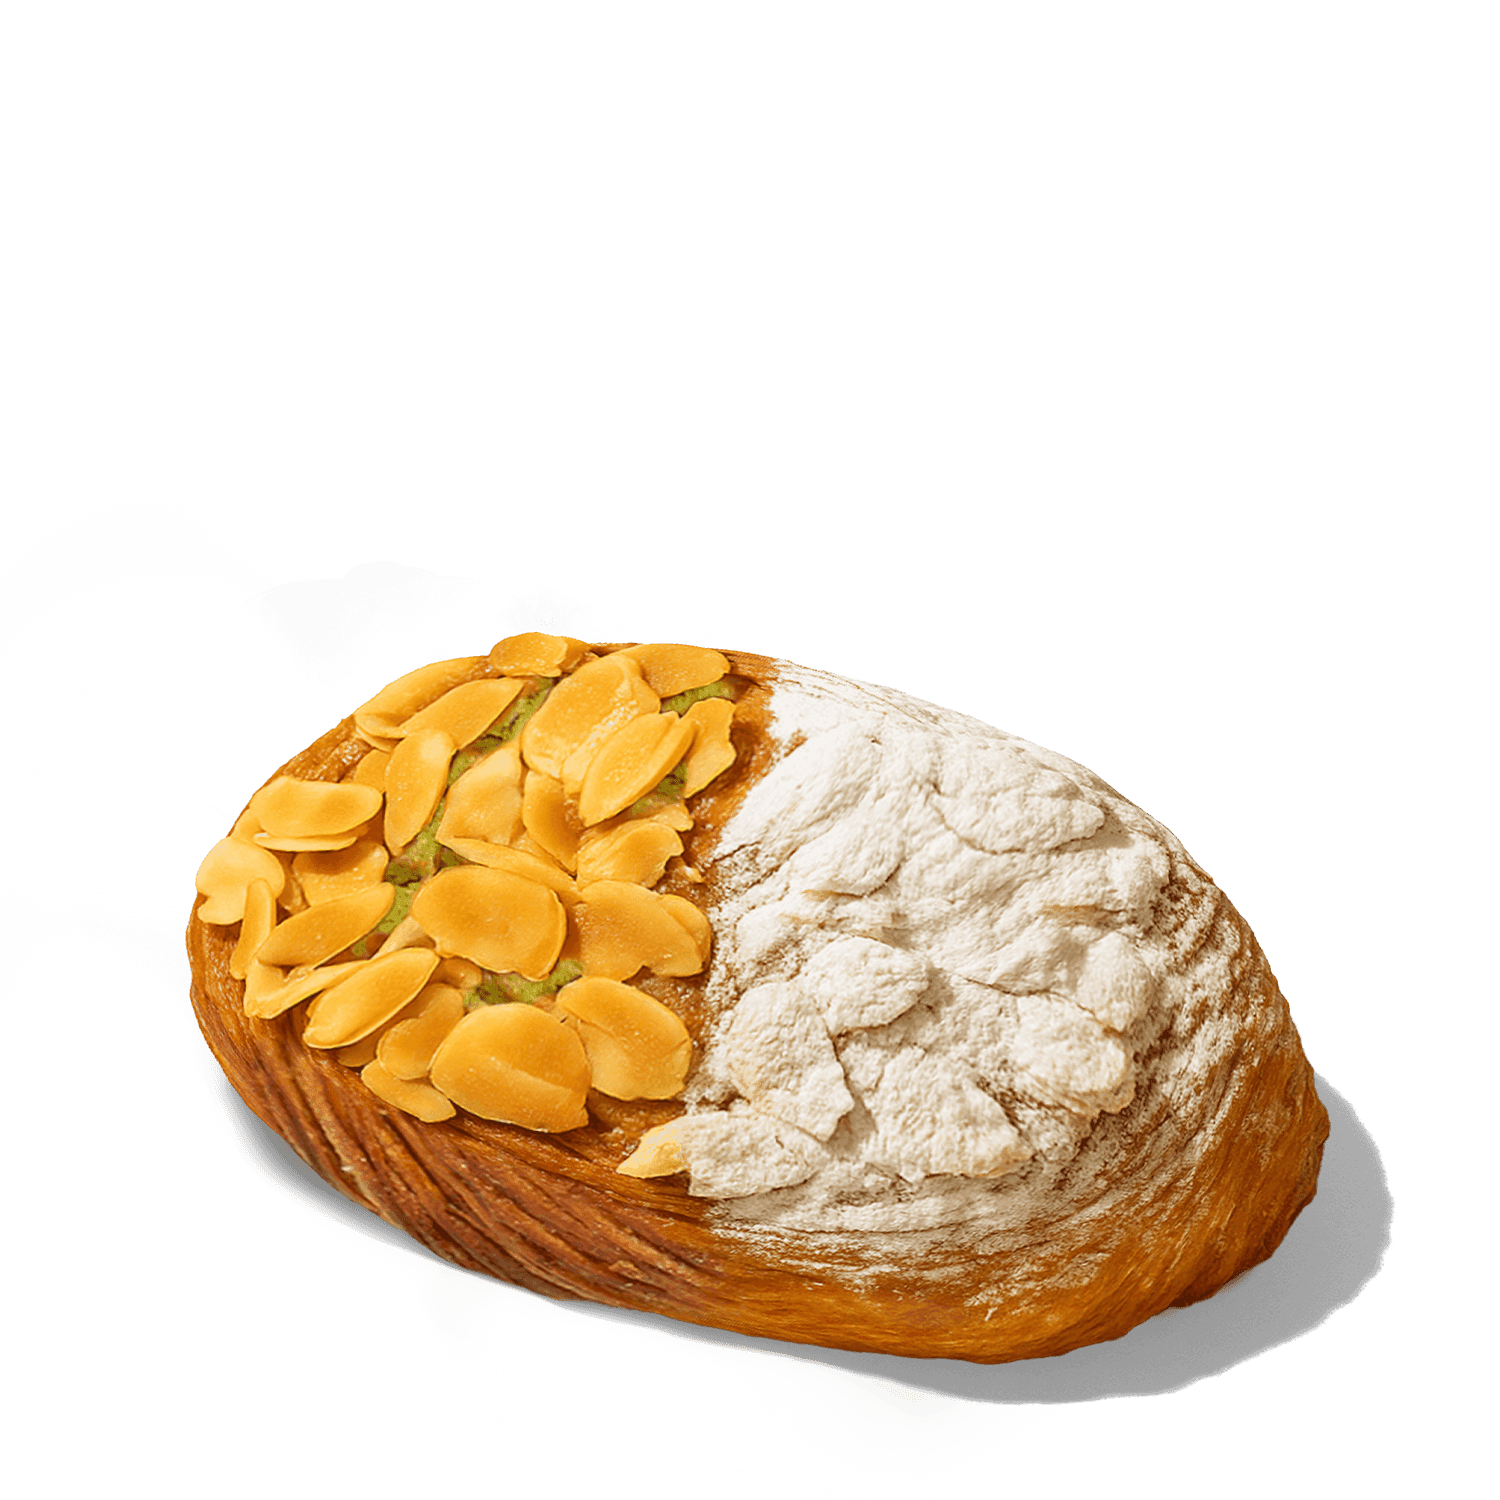
Pistachio & Raspberry Delice
Per 55g
- Energy
- 2,218 kJ
- Calories
- 530 kcal
- Protein
- 9 g
- Carbohydrates
- 66 g
- Sugars
- 35 g
- Fat, total
- 25 g
- Fat, saturated
- 12 g
- Sodium
- 396 mg
- Fibre
- —
- Protein per 100 kcal
- 2 g
Nutrition figures come directly from Starbucks Australia's own published nutrition data.
Official source →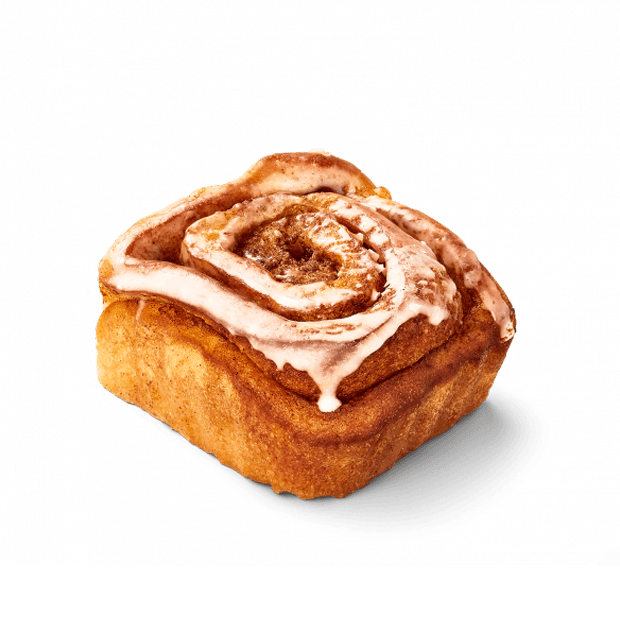
Starbucks
Cinnamon Scroll
Per 74g
- Energy
- 1,347 kJ
- Calories
- 322 kcal
- Protein
- 4 g
- Carbohydrates
- 42 g
- Sugars
- 22 g
- Fat, total
- 15 g
- Fat, saturated
- 10 g
- Sodium
- 249 mg
- Fibre
- —
- Protein per 100 kcal
- 1 g
Nutrition figures come directly from Starbucks Australia's own published nutrition data.
Official source →Starbucks Pistachio & Raspberry Delice Per 55g | Starbucks Cinnamon Scroll Per 74g | |
|---|---|---|
| Energy | 2,218 kJ | 1,347 kJ |
| Calories | 530 kcal | 322 kcal |
| Protein | 9 g | 4 g |
| Carbohydrates | 66 g | 42 g |
| Sugars | 35 g | 22 g |
| Fat, total | 25 g | 15 g |
| Fat, saturated | 12 g | 10 g |
| Sodium | 396 mg | 249 mg |
| Fibre | — | — |
| Protein per 100 kcal | 2 g | 1 g |
| Source | Nutrition figures come directly from Starbucks Australia's own published nutrition data. Official source → | Nutrition figures come directly from Starbucks Australia's own published nutrition data. Official source → |
You can compare up to 4 items. Search for another item to add →