
Compare
Side-by-side nutrition for the items you've picked. Not a claim about which is "healthier" overall — just the numbers, so you can weigh the tradeoffs yourself.
Highest protein
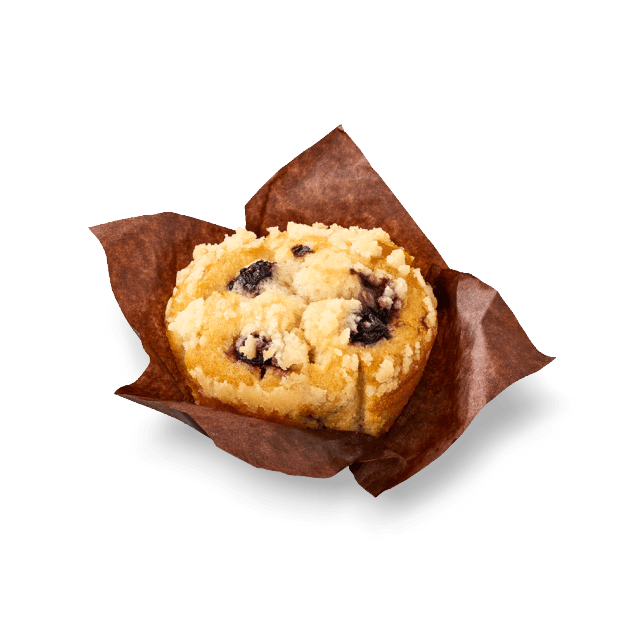
Blueberry Crumble Muffin
Lowest calories
Cinnamon Scroll
Best protein per calorie
Cinnamon Scroll
Starbucks
Blueberry Crumble Muffin
Per 150g
- Energy
- 2,175 kJ
- Calories
- 520 kcal
- Protein
- 6 g
- Carbohydrates
- 70 g
- Sugars
- 1 g
- Fat, total
- 24 g
- Fat, saturated
- 2 g
- Sodium
- 542 mg
- Fibre
- —
- Protein per 100 kcal
- 1 g
Nutrition figures come directly from Starbucks Australia's own published nutrition data.
Official source →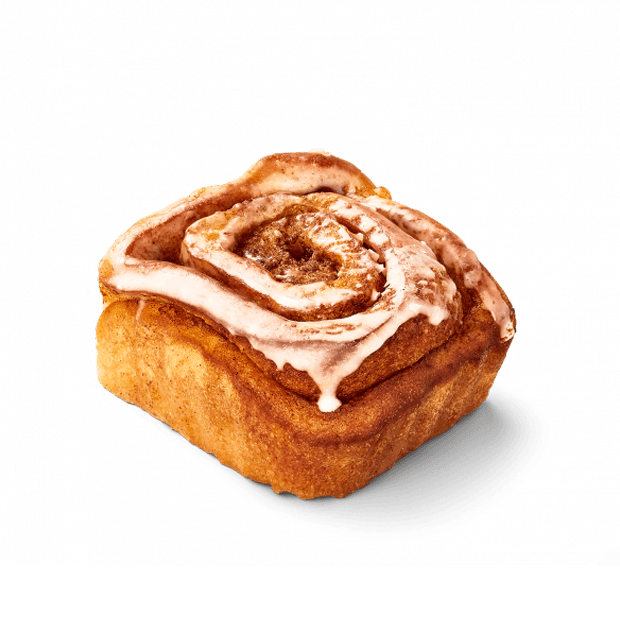
Starbucks
Cinnamon Scroll
Per 74g
- Energy
- 1,347 kJ
- Calories
- 322 kcal
- Protein
- 4 g
- Carbohydrates
- 42 g
- Sugars
- 22 g
- Fat, total
- 15 g
- Fat, saturated
- 10 g
- Sodium
- 249 mg
- Fibre
- —
- Protein per 100 kcal
- 1 g
Nutrition figures come directly from Starbucks Australia's own published nutrition data.
Official source →Starbucks Blueberry Crumble Muffin Per 150g | Starbucks Cinnamon Scroll Per 74g | |
|---|---|---|
| Energy | 2,175 kJ | 1,347 kJ |
| Calories | 520 kcal | 322 kcal |
| Protein | 6 g | 4 g |
| Carbohydrates | 70 g | 42 g |
| Sugars | 1 g | 22 g |
| Fat, total | 24 g | 15 g |
| Fat, saturated | 2 g | 10 g |
| Sodium | 542 mg | 249 mg |
| Fibre | — | — |
| Protein per 100 kcal | 1 g | 1 g |
| Source | Nutrition figures come directly from Starbucks Australia's own published nutrition data. Official source → | Nutrition figures come directly from Starbucks Australia's own published nutrition data. Official source → |
You can compare up to 4 items. Search for another item to add →